Welcome
This page was created by Mark S. Hoffman to share information about slowing the growth (and eventually stopping) COVID-19.
This is what I posted on Facebook on 4/6/20.
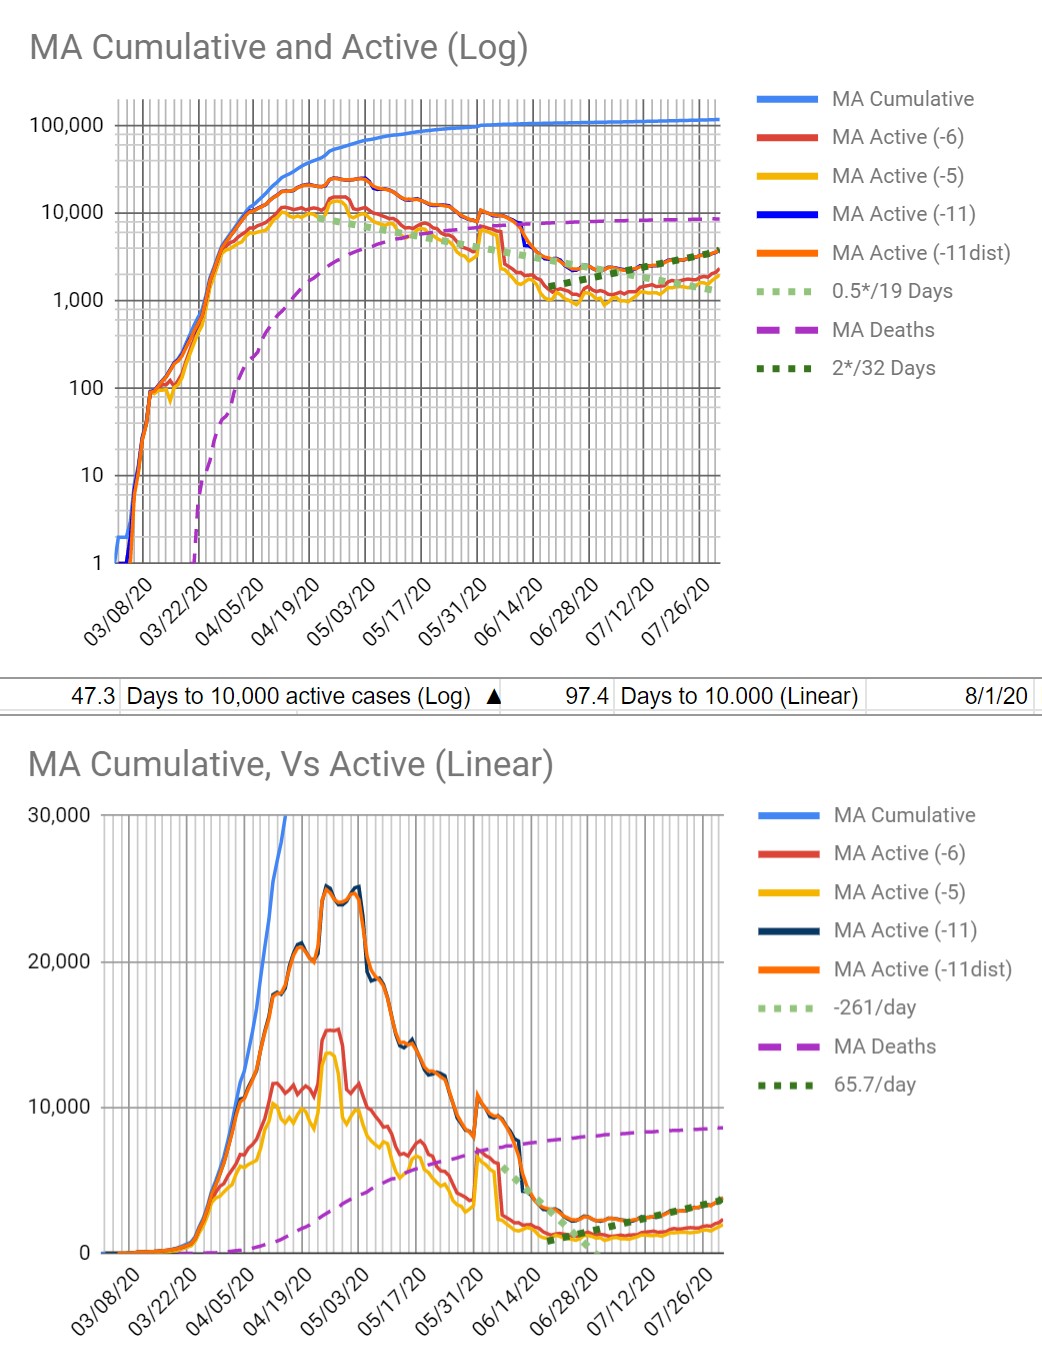
This is a chart of active cases for 8/01/20. I show active cases, as below, plus distributed over 8-14 days. There are notes between the graphs for time to get to 10,000 cases based on the log trend line and the linear trend line. I compute an Rt of 1.11 compared to 1.08 on Rt.Live, which takes the amount of testing and other things into account.
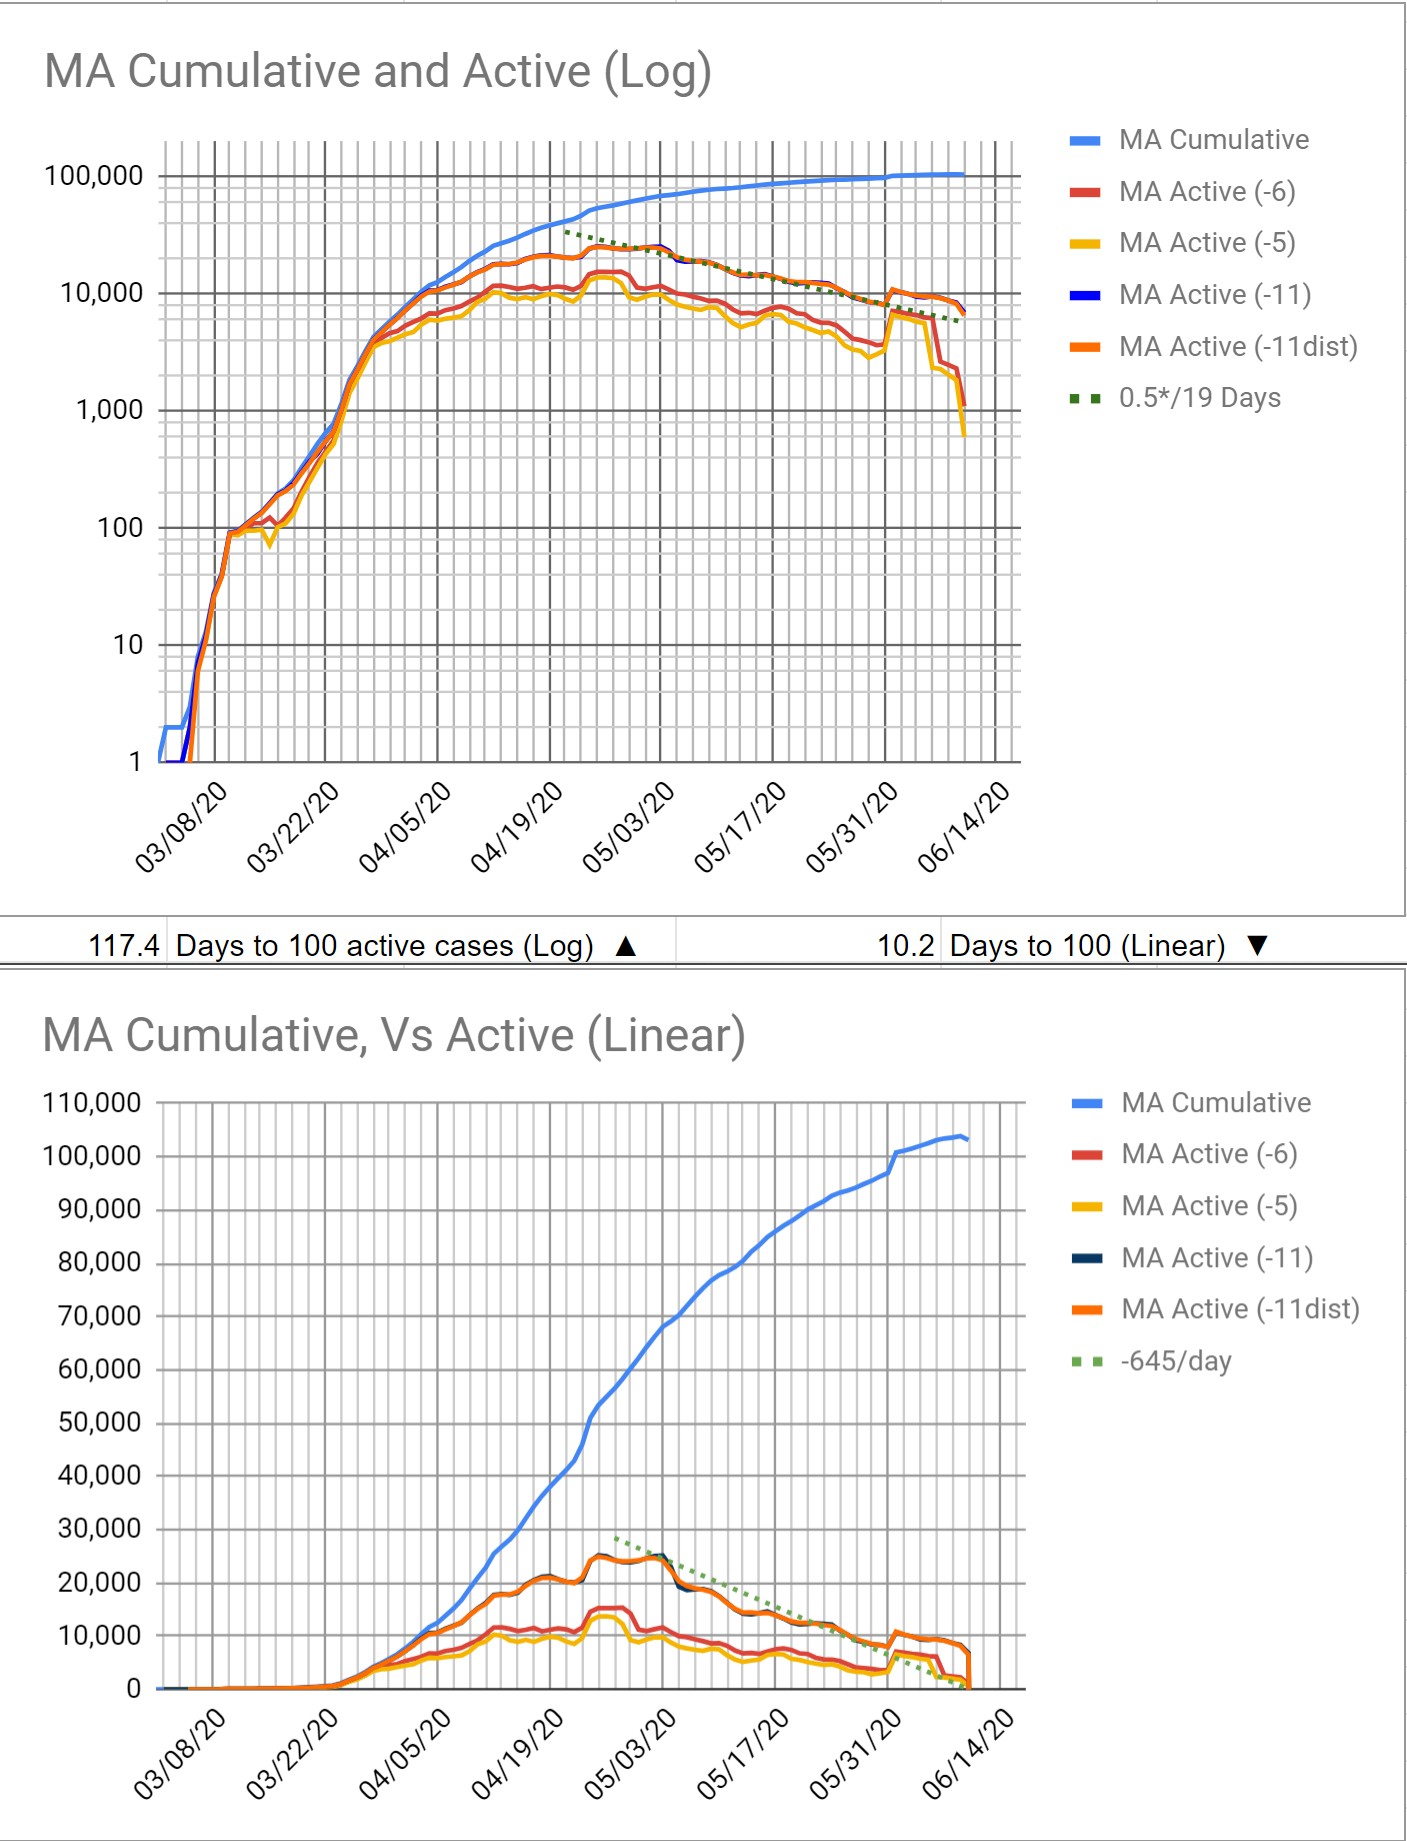
This is a chart of active cases for 6/11/20. I show active cases, as below, plus distributed over 8-14 days. There are notes between the graphs for time to get to 100 cases based on the log trend line and the linear trend line.
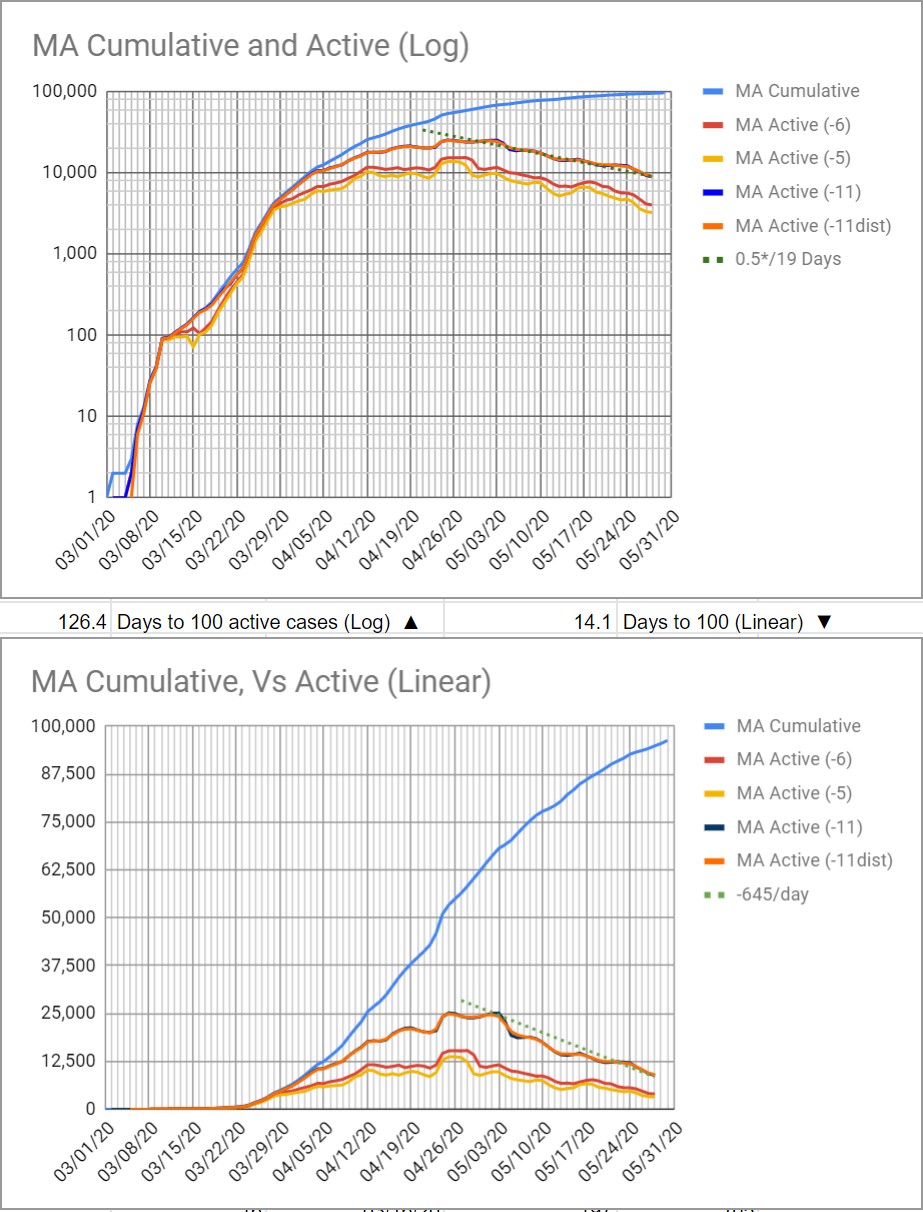
This is a chart of active cases for 5/31/20. I show active cases, as below, plus distributed over 8-14 days. There are notes between the graphs for time to get to 100 cases based on the log trend line and the linear trend line.)
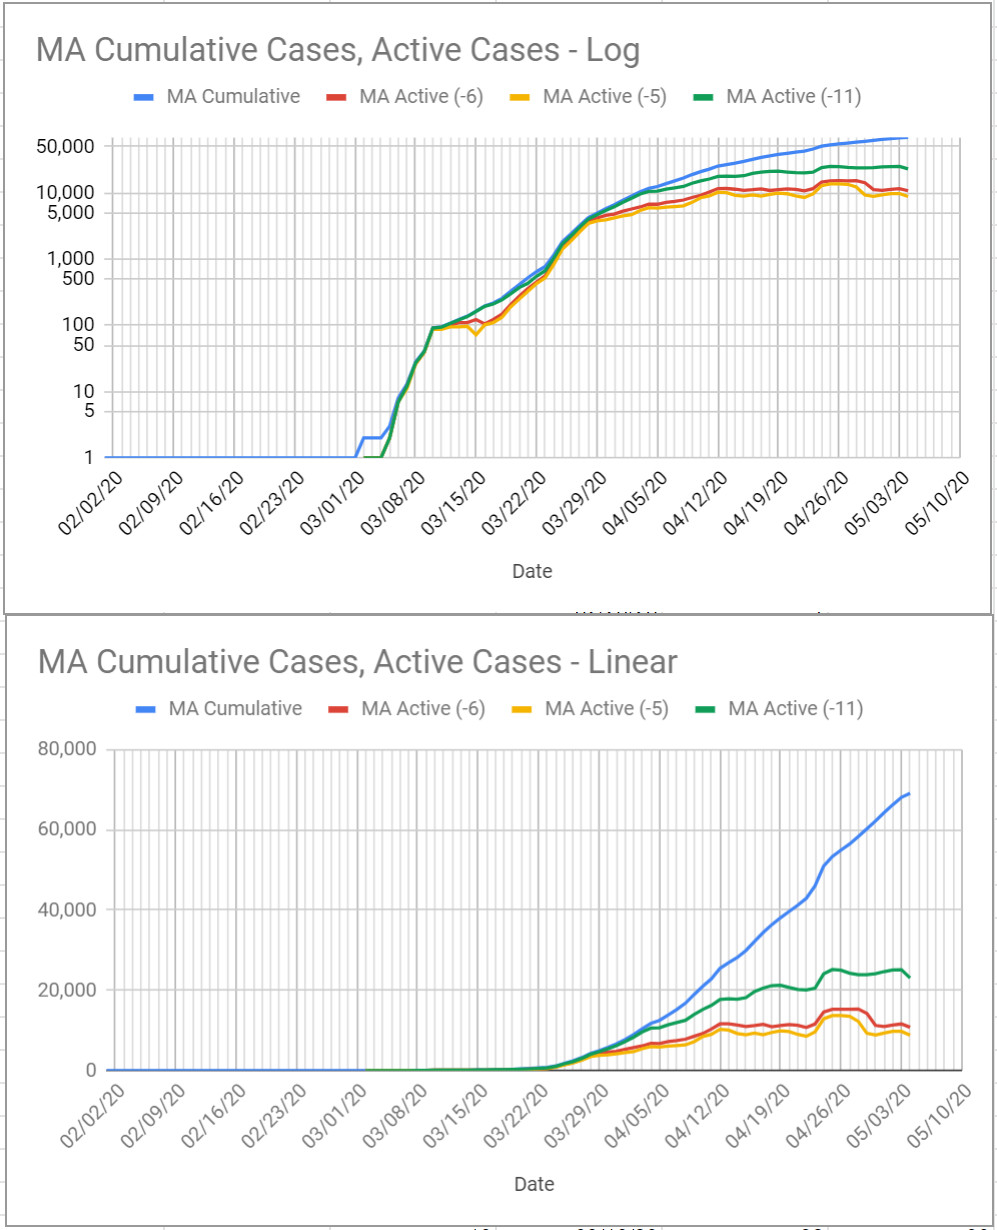
This is a chart of active cases for 5/05/20. I realized that the MA numbers were actually cummulative, so I subtracted out cases that were resolved after 11, 5, and 4 days. The bump on 4/24 (and its return n days later is probably due to increased testing.)
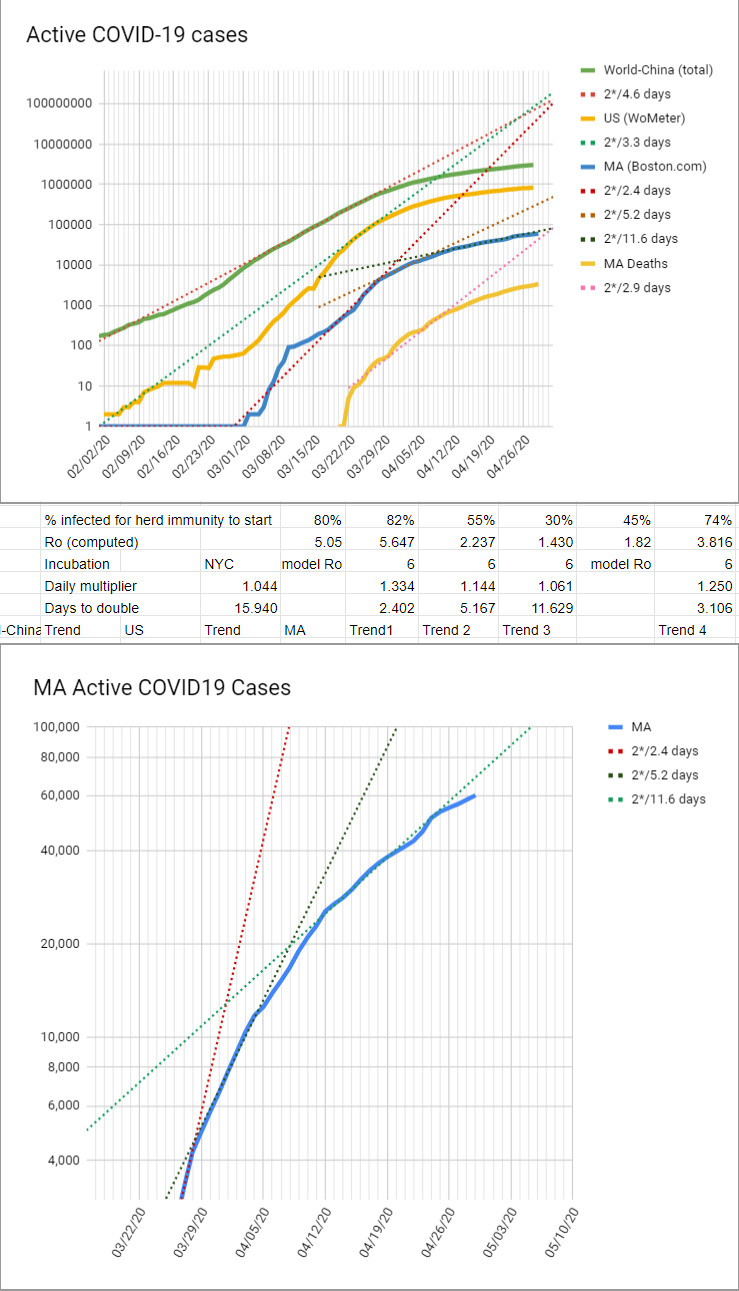
This is the chart for 4/30/20. (The last 5 days have been doubling at a rate of every 23 days.)
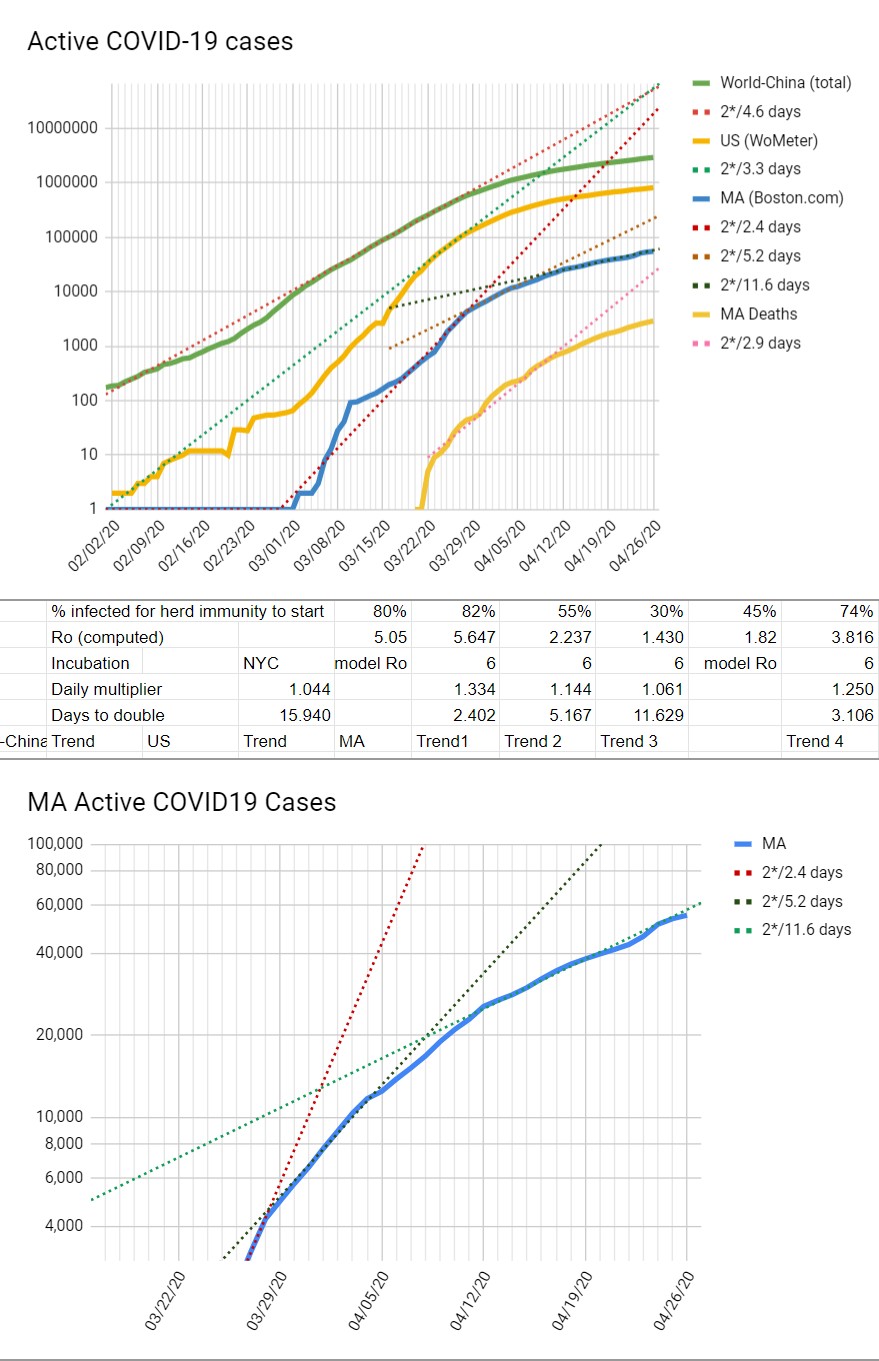
This is the chart for 4/29/20. (Now there have been 4 days at a slower doubling rate.)
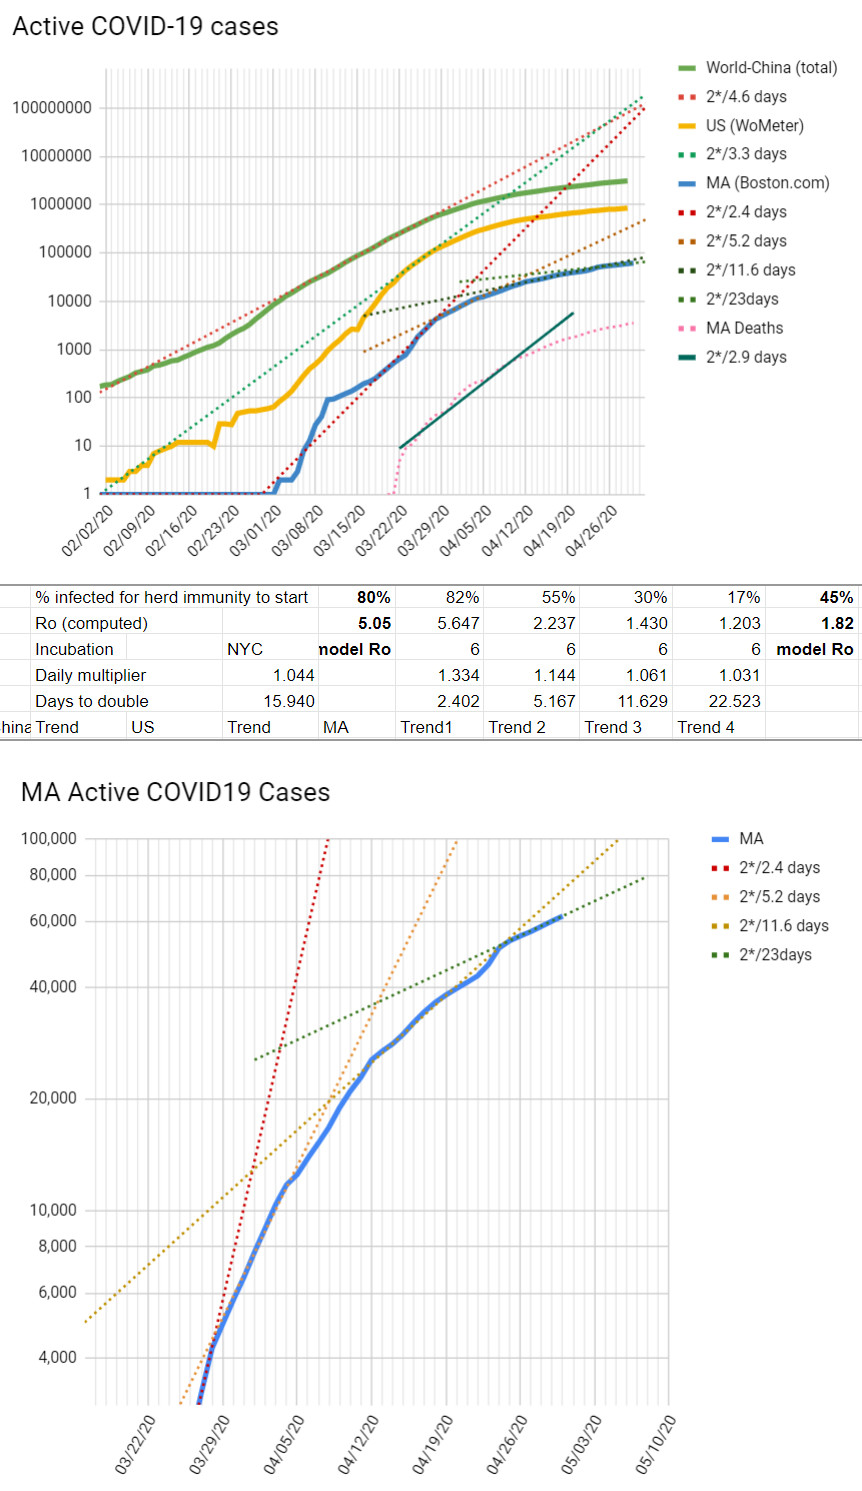
This is the chart for 4/27/20. (We had a few days below the line, then it went back up.)
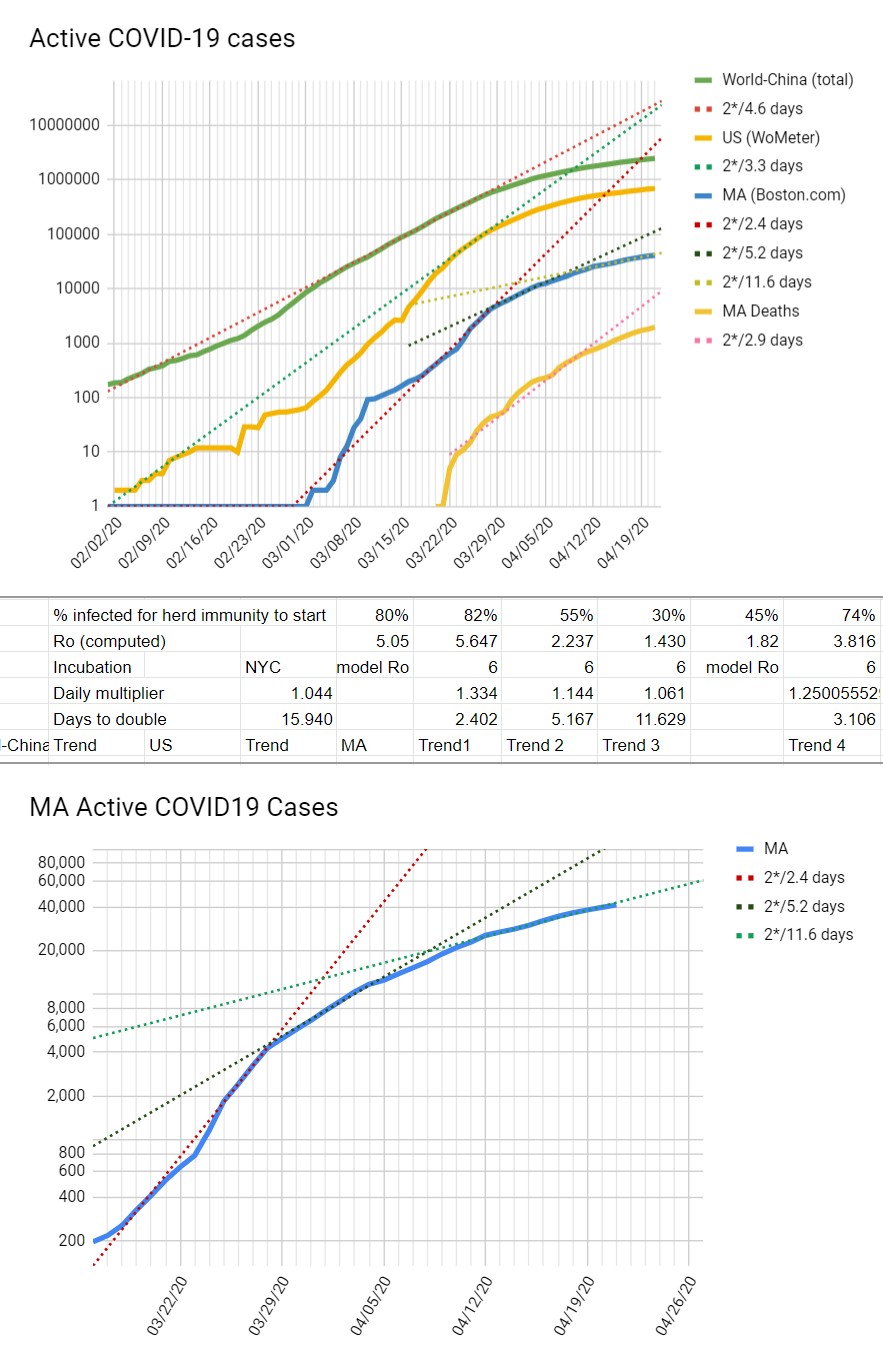
This is the chart for 4/23/20. (Use "Back" to get back to this page.)
This is the chart for 4/22/20. (Use "Back" to get back to this page.)
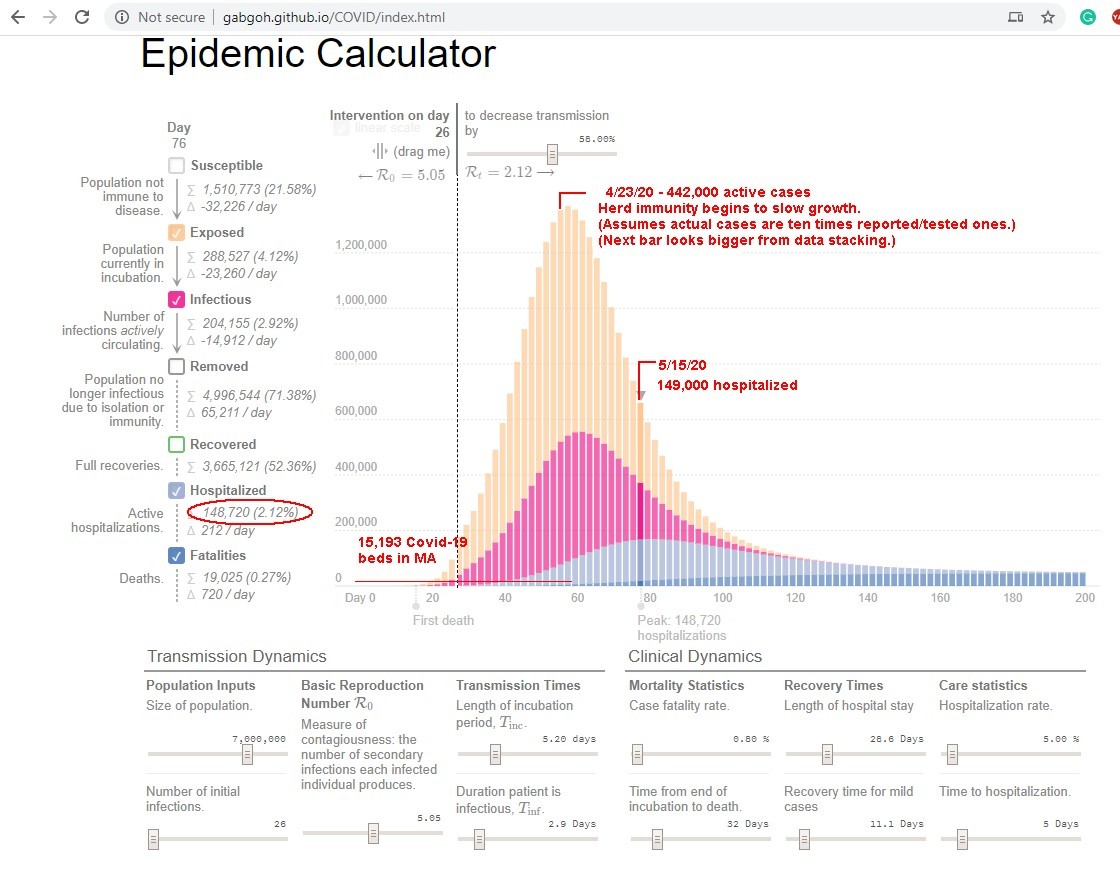
This is the epidemic model as of 4/21/20.I lowered the hospitalization rate to 5% and added more labels. Please send me feedback: Mark_S_Hoffman@Yahoo.com
(Use "Back" to get back to this page.)
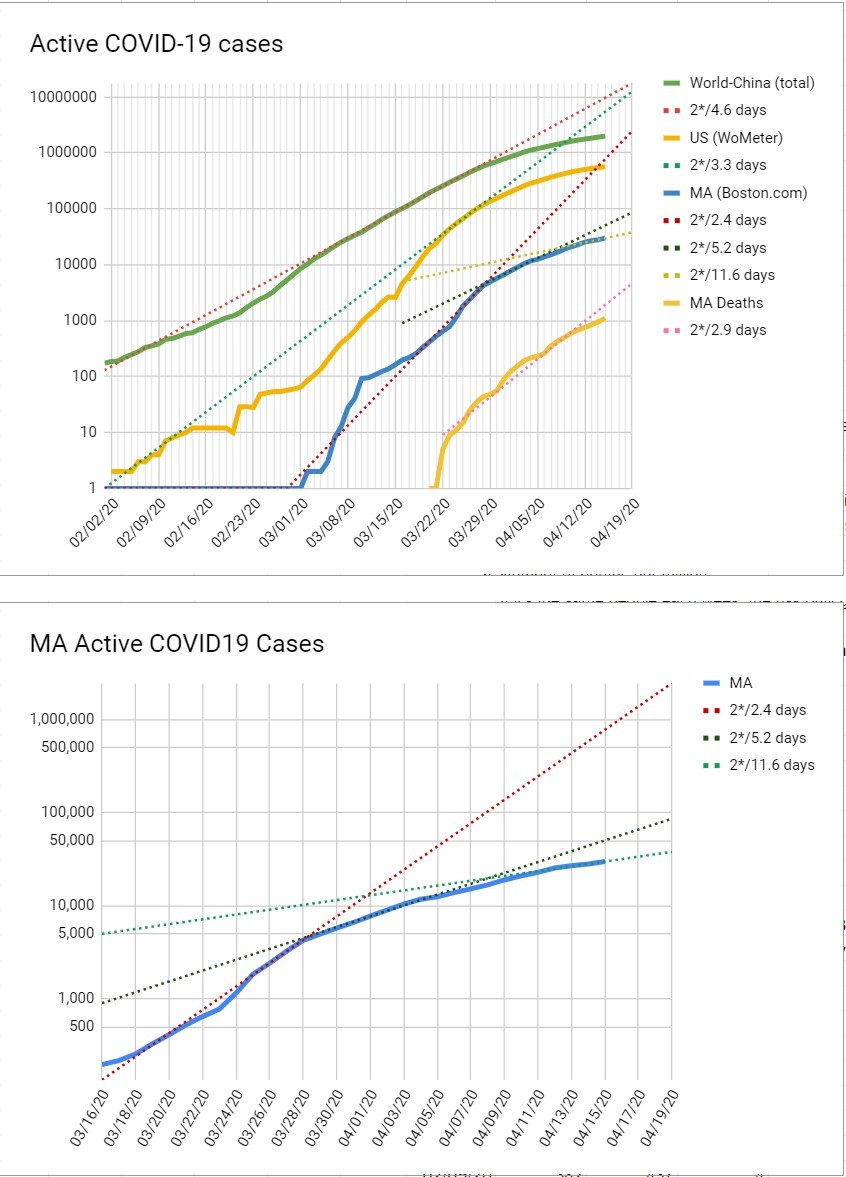
This is the chart for 4/16/20. (Use "Back" to get back to this page.)
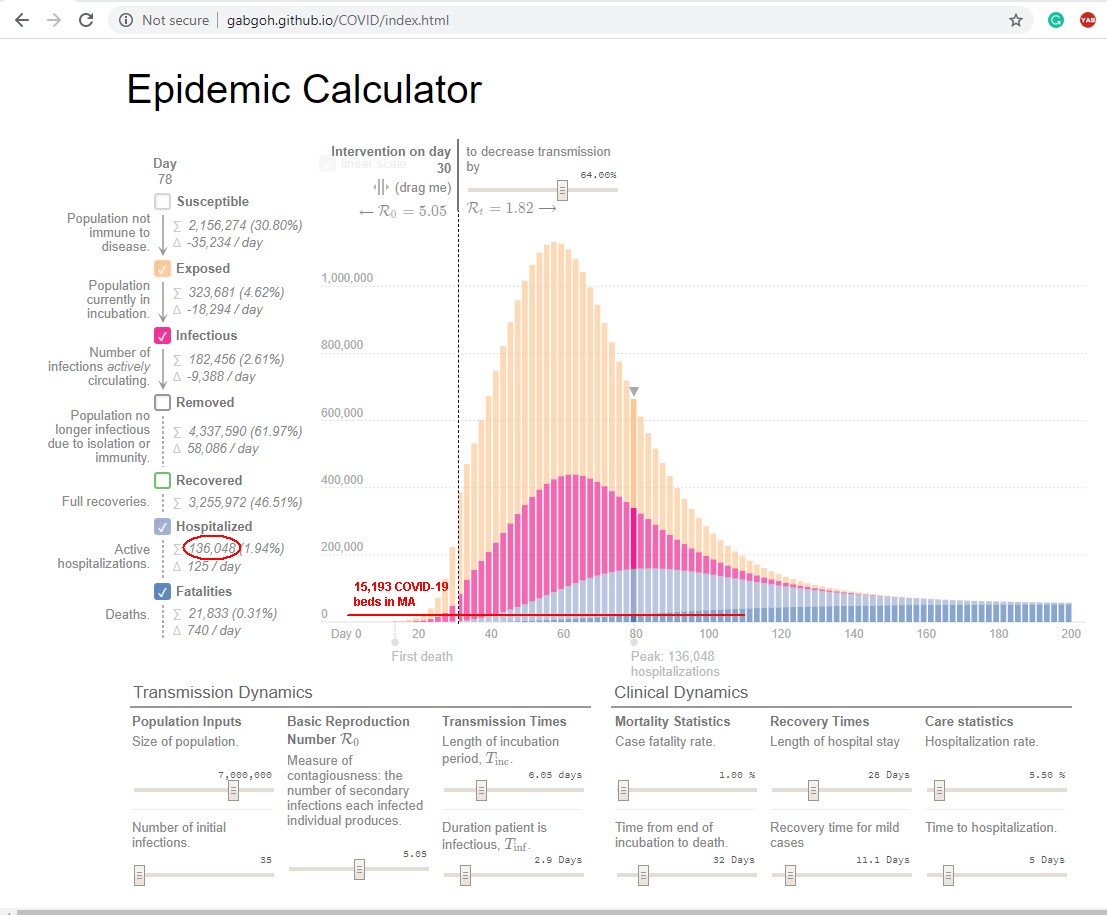
This is the epidemic model for 4/16/20.I fitted the data from trend 1 and trend 3.
It's my first try. Please send me feedback: Mark_S_Hoffman@Yahoo.com
(Use "Back" to get back to this page.)
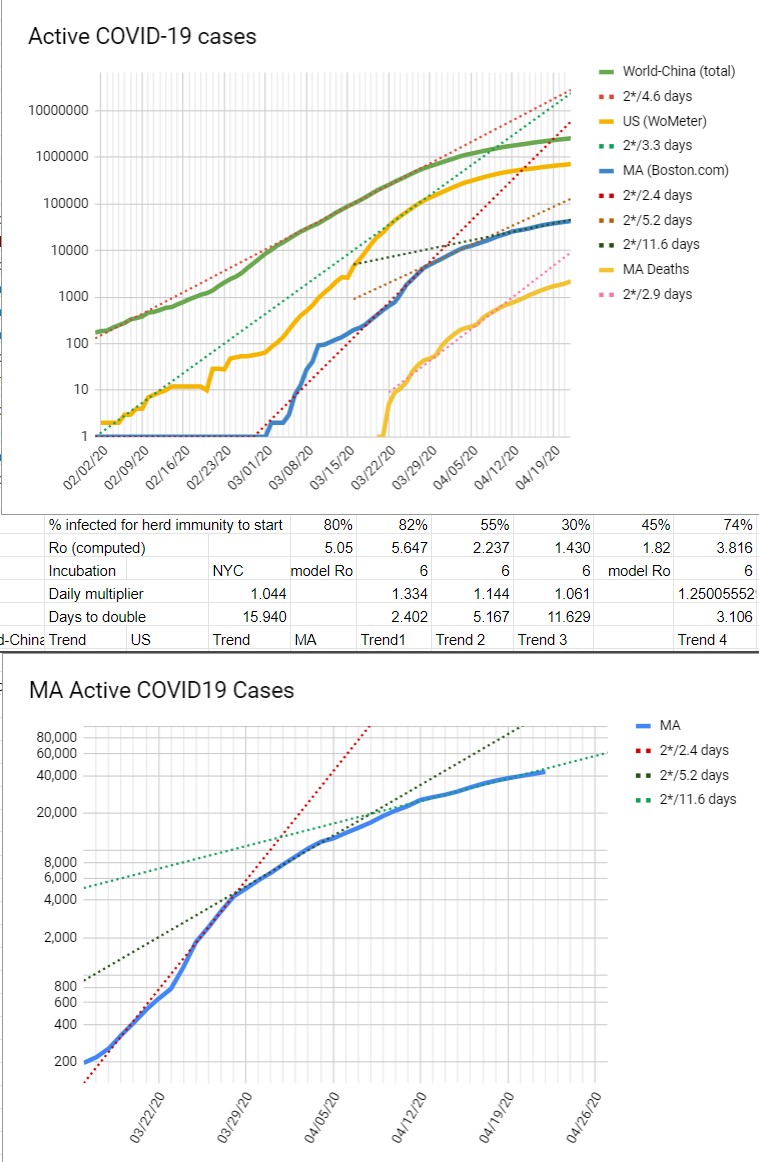
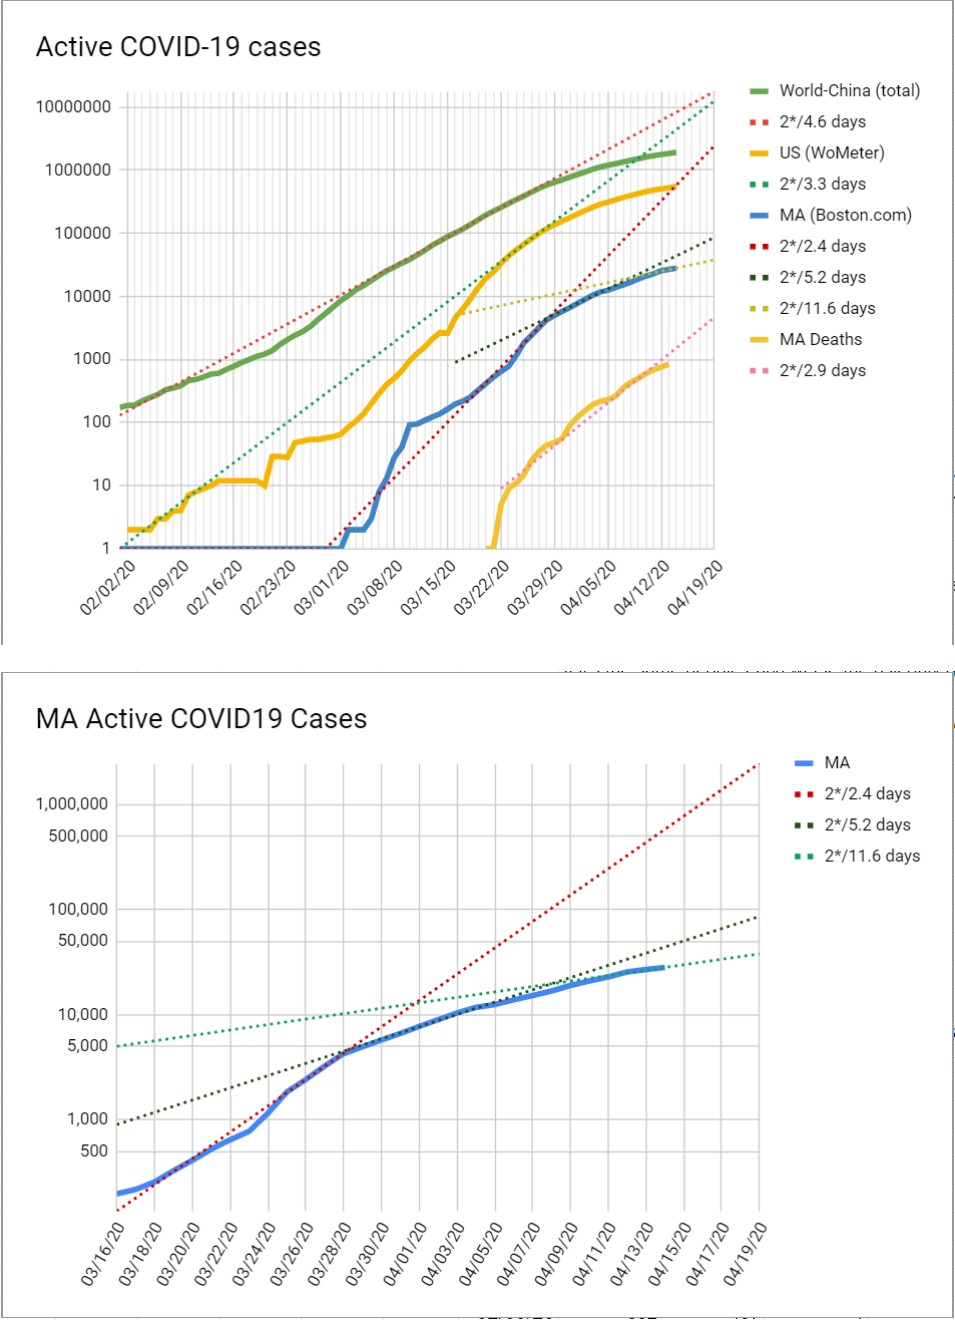
This is the chart for 4/15/20. People are getting better at isolation, but the growth is still exponential.
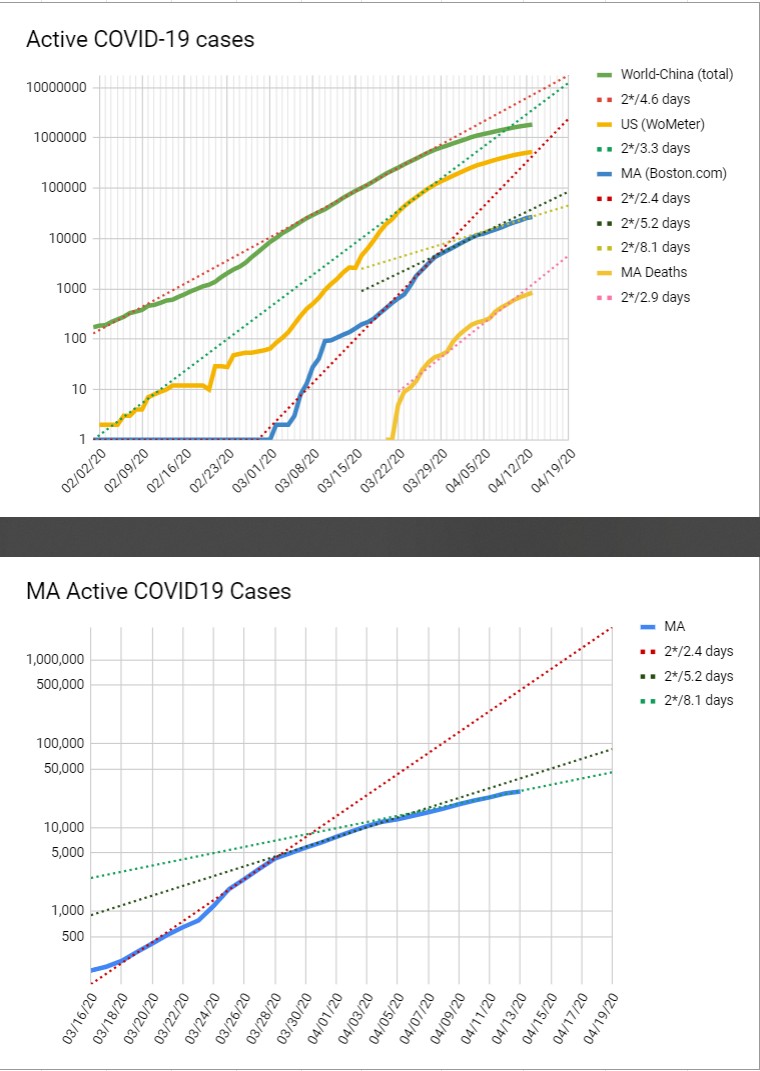
This is the chart for 4/14/20.
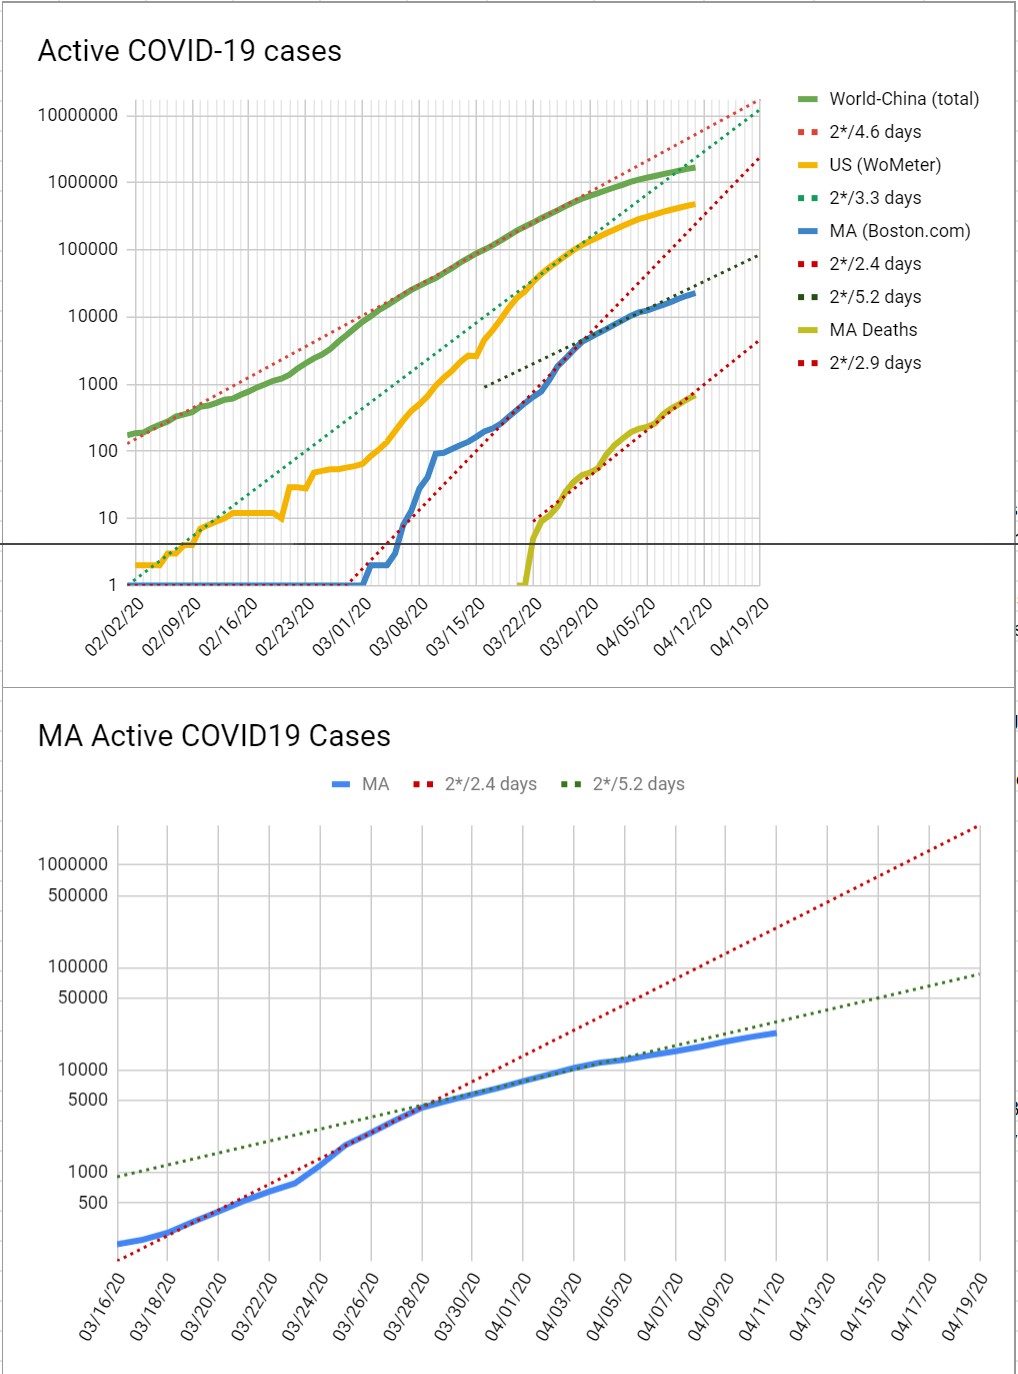
This is the chart for 4/12/20.